OPEN TO DATA ANALYST & BI OPPORTUNITIES

ANGELO MARTINEZ · DATA ANALYST

Data is the start.
Better decisions
are the point.

I turn complex business data into clear insights. From customer activation to inventory risk, I connect the analysis to the decision that comes next.

Bogotá, Colombia Open to remote roles

FROM THE ANALYSISPRODUCT ANALYTICS

Logins aren't the same
as customer value.

NordicFlow CRM · Portfolio case study

19activated accounts

101not activated

The business questionWhere does onboarding stop delivering value?

See the analysis behind the insight
Real project findings. Not decorative data.
MY ANALYTICS TOOLKIT
SQLPythonPower BITableauExcelGoogle SheetsData Storytelling

01 / SELECTED WORK

Business questions.
Evidence-led answers.

Four end-to-end portfolio projects.
Clear context, measurable findings,
and a practical next step.

These are portfolio analyses, not client engagements. Metrics describe the analyzed datasets; recommendations and projected benefits are not claimed as achieved business results.

SUPPLY CHAIN / NORDMARK01

How exposed is the inventory?

37–53%

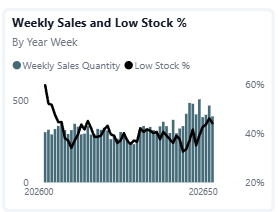
Stockout exposure in high-priority categories

Inventory & demandAug–Oct 2025

Make inventory risk visible.
Before it becomes a stockout.

Integrated sales, inventory and operations into a decision-ready model for omnichannel replenishment planning.

SQLDuckDBPower BIMedallion Architecture
Inside the analysis

The business question

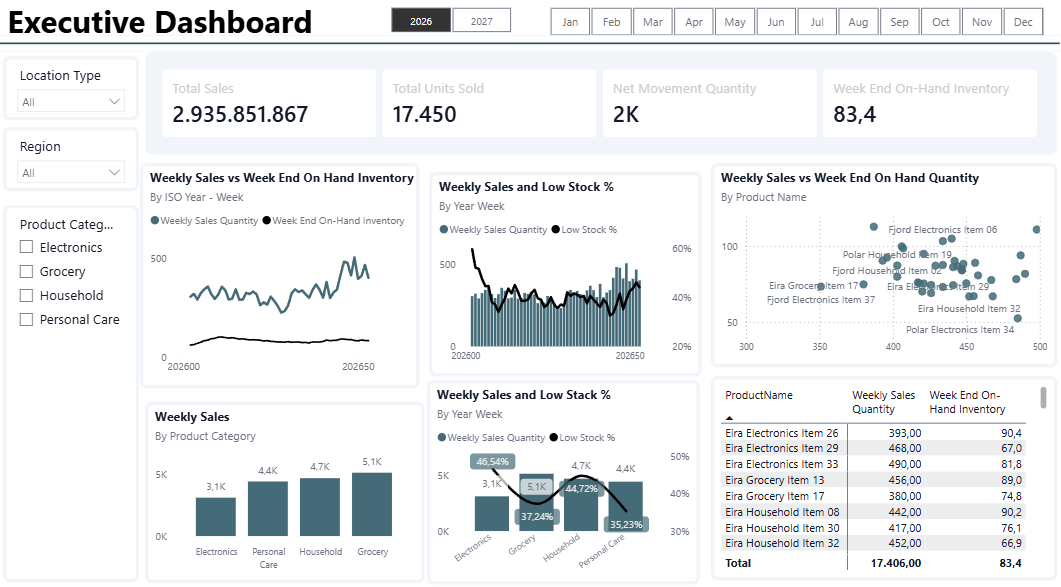
Where should an omnichannel retailer prioritize replenishment as demand and inventory flows become less predictable?

What I built

A Bronze–Silver–Gold pipeline using DuckDB and DBeaver, cleaning and validating 70,000+ records across four stores and an e-commerce channel. Power BI brings sales, stock movements and operational KPIs together.

Decision supported

Prioritize at-risk categories and use more granular forecasting and dynamic safety stock. Proposed schedules projected a potential 12% reduction in stockouts—not an observed reduction.

Scenario analysis using an extended predictive dataset for 2026–2027.

PRODUCT / NORDICFLOW02

Which accounts need attention?

77 inactive43 active
Activation & engagementFeb–Apr 2025

Measure customer value.
Not just platform activity.

Diagnosed onboarding friction and early churn risk by connecting activation, account health and time-to-value.

SQLPower BIProduct Analytics
Inside the analysis

The business question

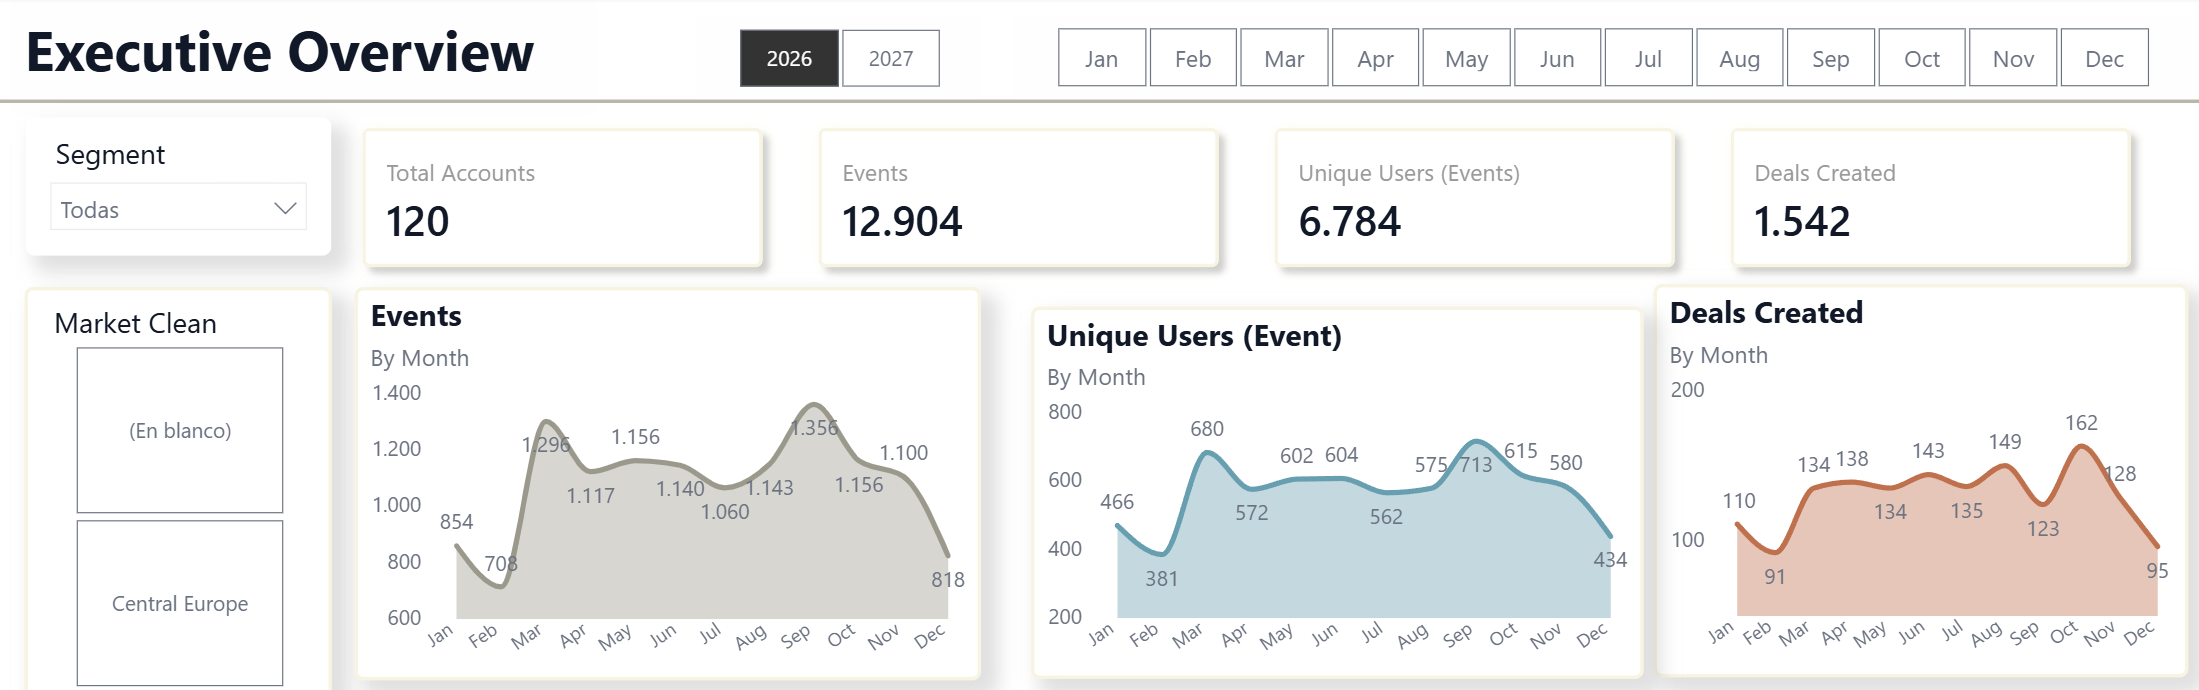
Why does a functioning B2B CRM still struggle to activate customers and sustain meaningful usage?

What I built

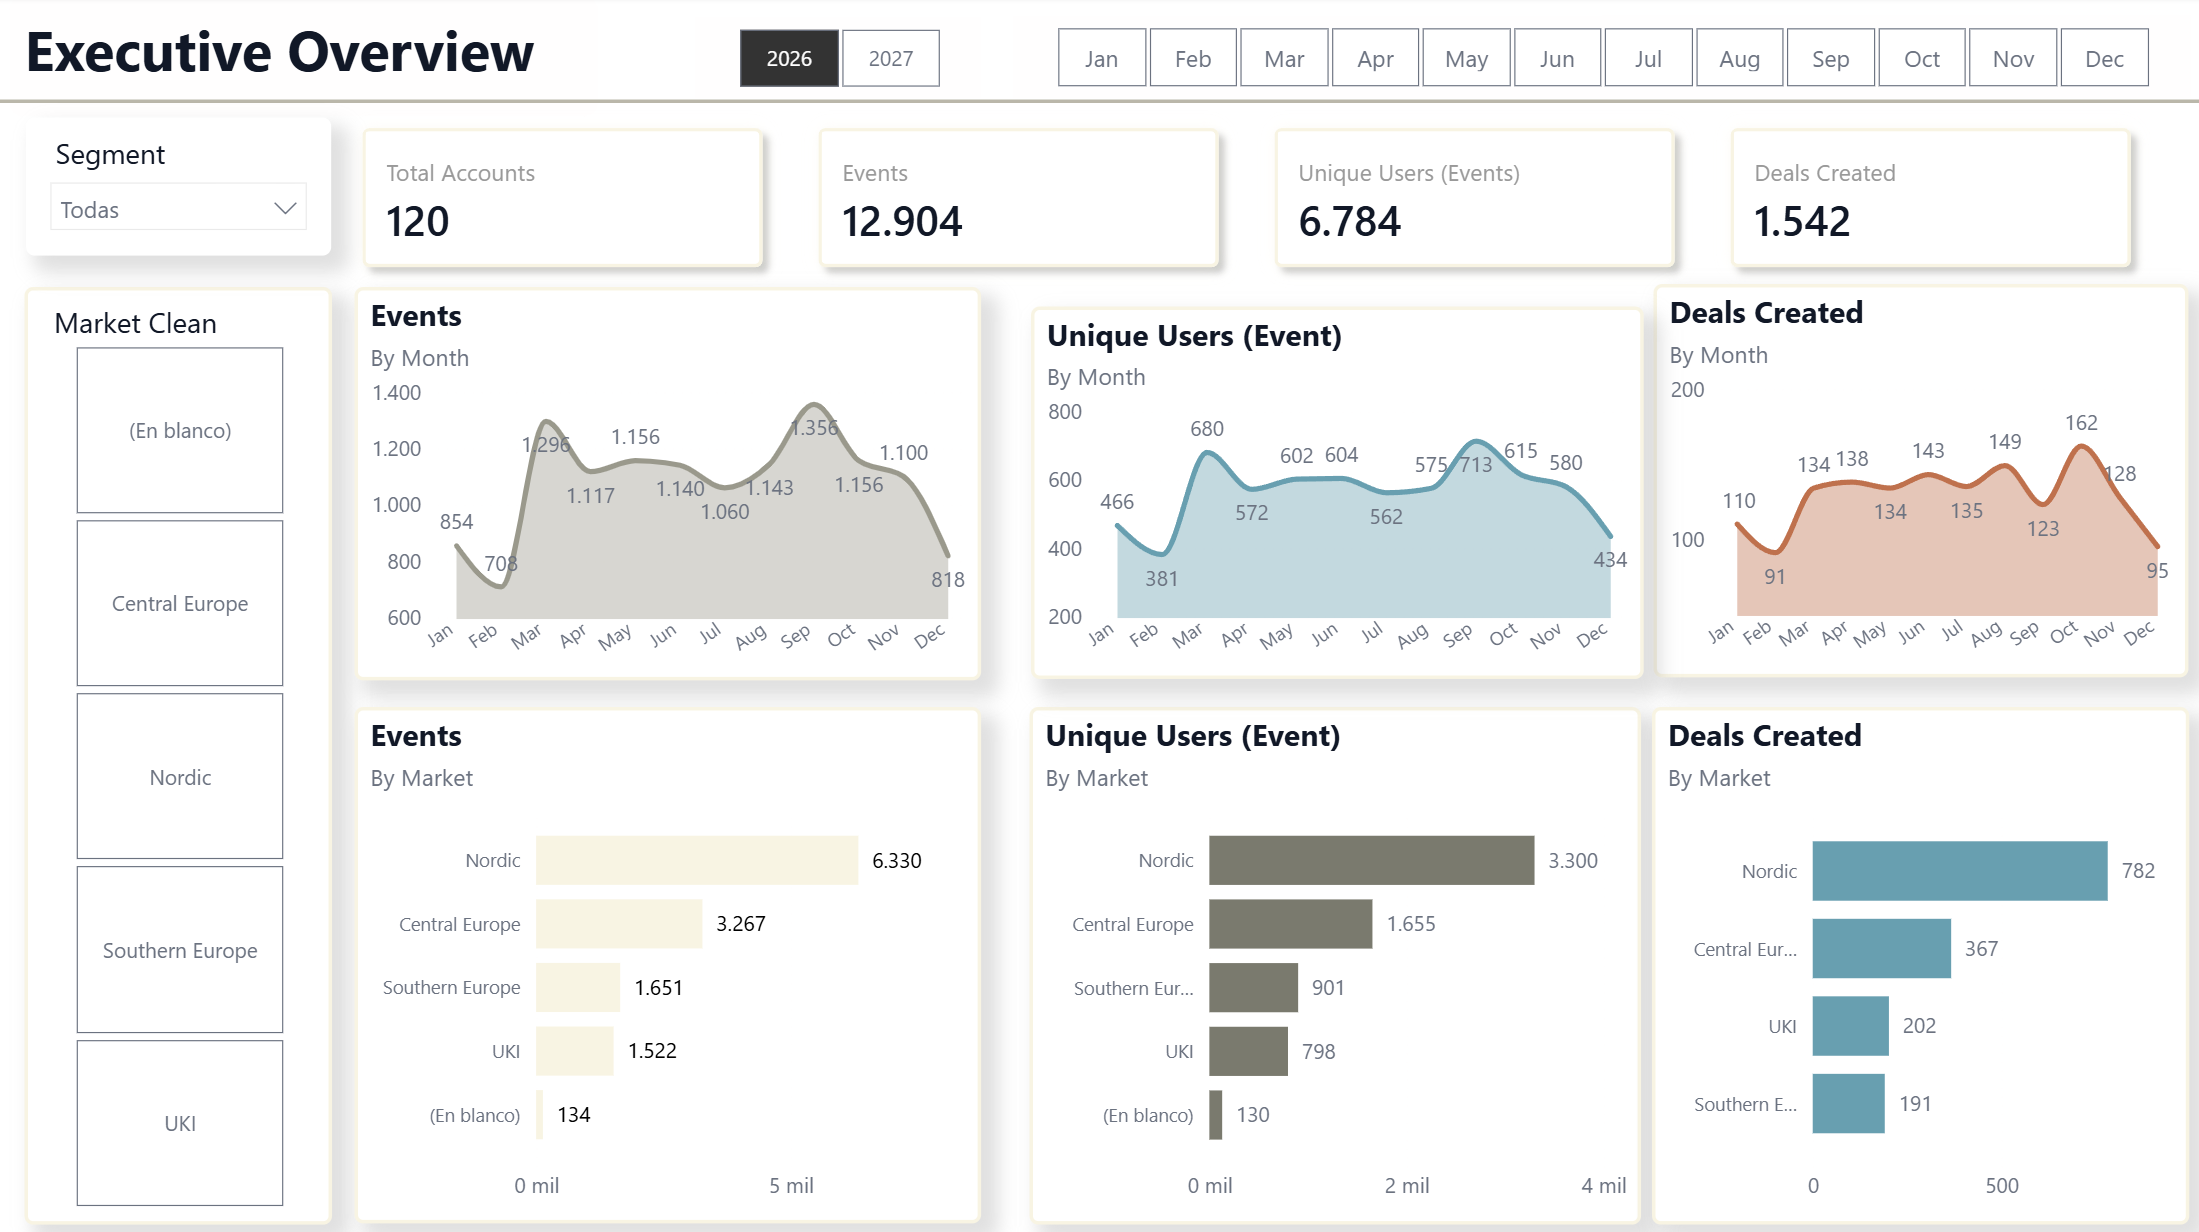
A SQL Medallion pipeline modeling 60,000+ transactions and a four-page Power BI report. The analysis connects 120 customers, 12,904 events and 1,542 commercial opportunities.

Decision supported

A 15.83% activation rate and 77 inactive accounts signaled onboarding and retention priorities. Recommendations focus on segment-specific onboarding and meaningful product usage rather than logins.

Scenario analysis using an extended predictive dataset for 2026–2027. Inactivity indicates risk, not confirmed churn.

MARKETING / SHOPEASY03

Where is conversion getting lost?

Conversion & sentimentMay–Jun 2025

Find the bottleneck.
Focus the marketing investment.

Connected customer journeys, content performance and review sentiment to identify higher-converting opportunities.

SQLPythonPower BIData Storytelling
Inside the analysis

The business question

Is e-commerce performance limited by traffic, or by where attention and marketing investment are directed?

What I built

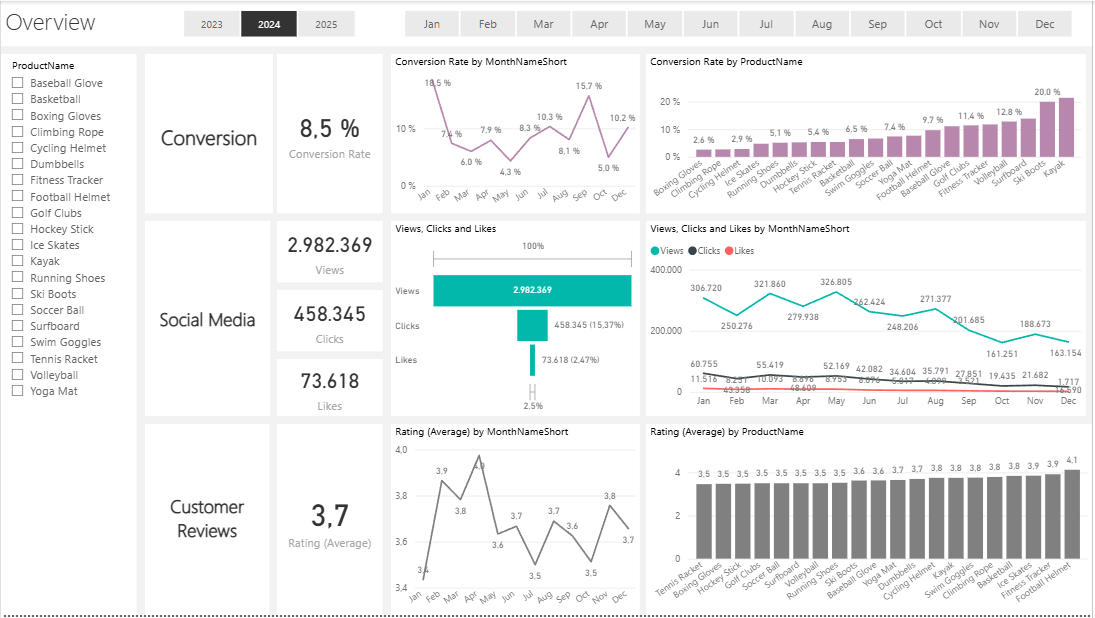
A SQL Medallion pipeline and interactive Power BI dashboards linking conversion and digital engagement. Sentiment analysis classified 446 reviews, including 275 positive and 82 negative entries.

Decision supported

The dataset's average conversion rate was 8.5%, with selected products converting up to 21%. Recommended prioritizing high-converting categories and investigating seasonal engagement declines.

Conversion rates are findings in the portfolio dataset, not improvements delivered to a client.

BUSINESS INTELLIGENCE / HEALTHCARE04

One model. A clearer hospital view.

14relational tables
3SQL views
5dashboard views
PatientsDoctorsHospitalFinance
Clinical, operational & financial BISep–Oct 2025

Bring scattered data together.
Give each team a useful view.

Transformed separate Excel sources into a relational model and a five-view executive dashboard for healthcare KPIs.

MySQLPower BIPower QueryDAX
Inside the analysis

The business question

How can clinical, operational and financial teams work from connected information rather than isolated spreadsheets?

What I built

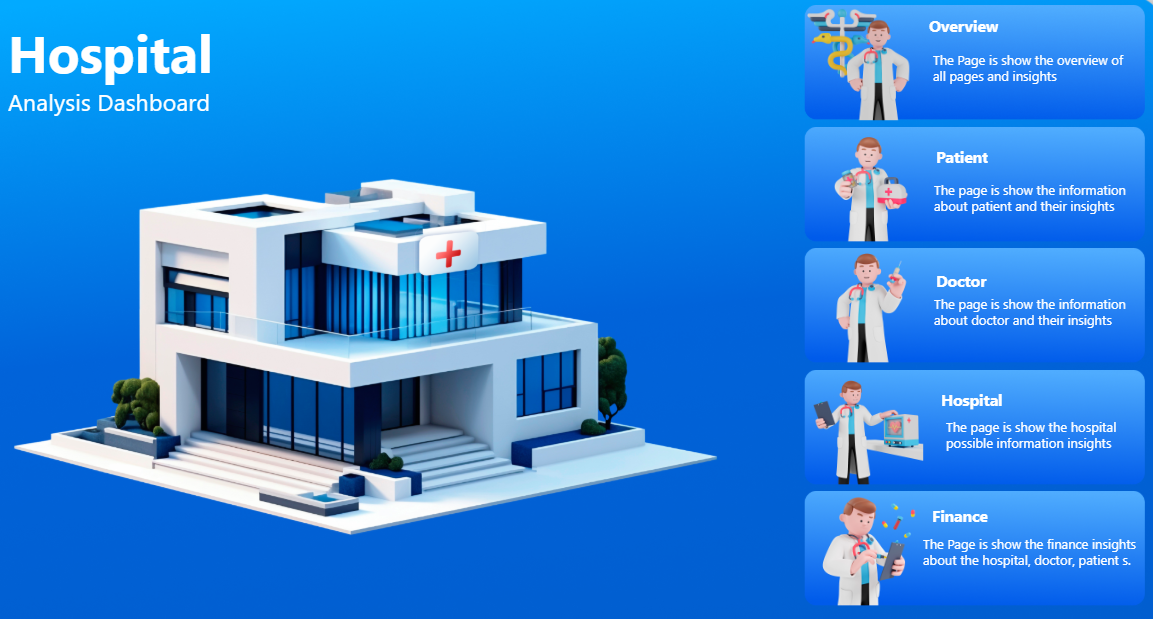
A MySQL database with 14 related tables and three custom views, supported by Power Query transformations and DAX measures. The report includes Overview, Patients, Doctors, Hospital and Finance views.

Decision supported

Centralized monitoring of bed occupancy, wait times and billing, with different perspectives for clinical and management users. SQL views prepare data for analysis before it reaches the report.

The reported outcome is the BI solution and reporting coverage. No unverified time-saving or financial uplift is claimed.

The model makes the data reliable. The story makes it useful.

02 / HOW I WORK

Business context first.
Tools with a purpose.

I work across the analytics lifecycle, connecting reliable data with a clear narrative and a business decision.

01

Ask the right question

Connect the KPI to the decision: inventory availability, conversion, activation or operational performance.

Business analysisKPI definition
02

Build reliable data

Clean, validate and model data so the analysis rests on traceable, structured information.

SQLPythonMedallion Architecture
03

Make the insight clear

Use focused visualizations and Data Storytelling to explain what changed, why it matters and what to investigate.

Power BIDAXTableau
04

Inform the next move

Translate the findings into practical priorities. Keep observed results, risks and projected benefits distinct.

RecommendationsExecutive communication
CONTINUOUS LEARNING

Data Science — SQL, Python & RStudioA2 Aprende y Aplica · Jan 2026

Tableau Visualización de DatosA2 Aprende y Aplica · Aug 2025

03 / EXPERIENCE & BACKGROUND

An analyst's mindset.
A business foundation.

My experience in customer support and business development gives me a practical view of the people, processes and decisions behind the data.

Industrial Engineering is the foundation. Data Analytics & Business Intelligence is the direction.

Full experience on LinkedIn
FEB–SEP 2024Remote · Bogotá

Customer Support Agent

FlipTalk · EdTech

Supported subscription management and real-time incident resolution, working with tutors and the support team.

  • 15% shorter response times through performance tracking and bottleneck follow-up.
  • Reduced incident resolution time by more than 10 minutes and supported customer retention through subscription follow-up.
JUL–DEC 2023Hybrid · Bogotá

New Business Development Apprentice

WSP en Colombia

Organized business information and supported due diligence and documentation for tenders and consulting opportunities.

  • 15% less time searching for information by structuring and centralizing project references in Excel.
  • Contributed to a 12% increase in tender participation through documentation centralization and validation in SharePoint.
FEB 2019–MAY 2024Education

Industrial Engineering

Universidad Militar Nueva Granada

A complementary foundation in operations research, processes and supply chain optimization.

AVAILABLE FOR MY NEXT OPPORTUNITY

Looking for someone
who connects the dots?

I'm seeking Junior Data Analyst and Business Intelligence Analyst opportunities in Bogotá or remotely. Let's talk about the decisions your team needs to make.

Get in touch